
Examining Product Correlation in Customer Purchase Baskets
My self-assigned task was to look at all of the purchasing our customers have done and see whether there are any strong correlations between any purchased items. If we can find some strong correlations then we can make some suggestions to customers about other products they may find interesting.
It seemed like a pretty quick task with Python and Pandas.
Our data does not include person-identifying information. Since we cannot form customer identities, about the best we can hope to identify is intra-order product correlation.
There are about 200 products in this case. That’s a lot of information to try to understand. Here’s a little snapshot of a cross-tab that I put together in SQL:
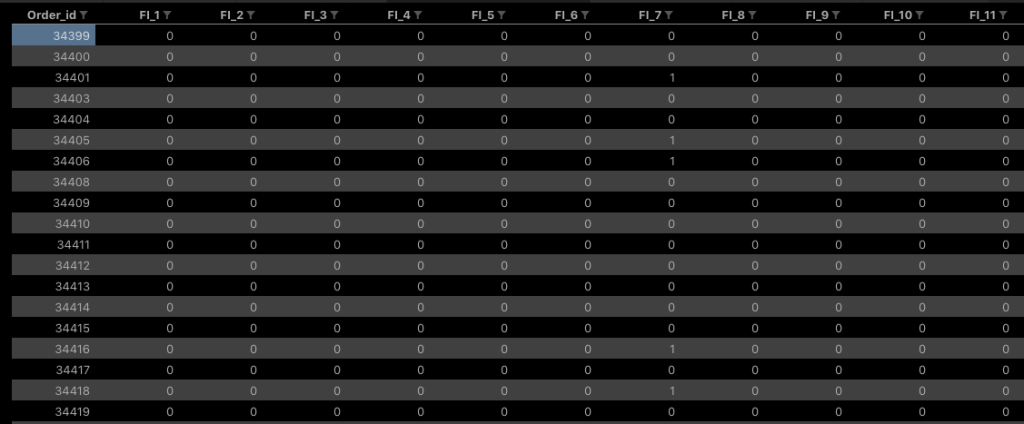
The list of orders and products is a lot of data to look at, but pandas really has no problem with a matrix that is 20,000 rows by 200 columns. A single line of code gets your data loaded: df = pd.read_csv('correlation_in.csv',).
Two more lines of code and you can determine the correlations between all 200 products across the 20,000 purchases and write the data out. Wow!
c = df.corr()
c.to_csv('correlation_out.csv')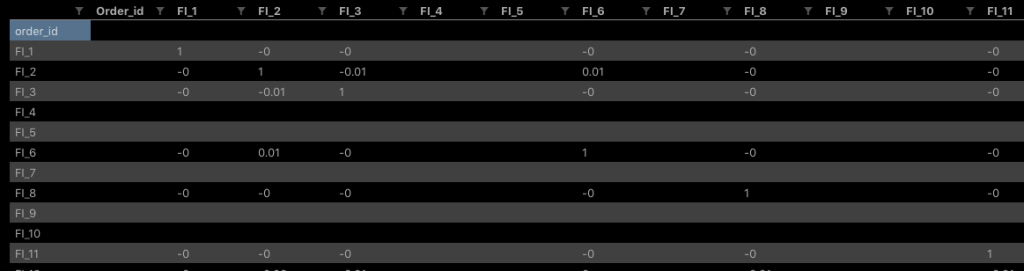
It’s easy to build this correlation matrix. But it’s 200 products by 200 products, 40,000 cells. How does one even begin to make sense of that?!?
By stacking the correlation matrix dataframe, the data set becomes something that we can actually understand using a spreadsheet. Stacking the data and writing to another file is a one-liner:
c.stack().to_csv('correlation_out_stacked.csv')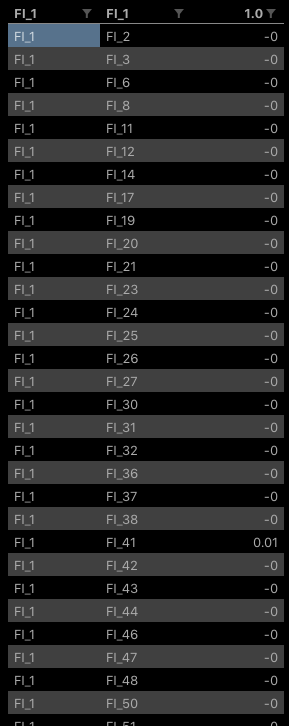
Looking at the stacked version of the matrix in Excel you can sort by the correlation score and ignore the rows where the two correlated products are actually the same product.
In my case, using Excel I was able to see fairly quickly that the correlations between products were not strong enough to pursue and possibly automate this project.
Maybe this is enough for you to find out that there is a nugget of gold worth pursuing yourself!